Last updated: 25 August 2026 · covers version 1.3.2
ReefTracker is an offline-first reef-aquarium companion for Android and iOS. It keeps your water tests, dosing, maintenance and equipment in one place – stored on your device unless you choose your own Google Drive or iCloud backup, with no account, no cloud requirement and no ads. This guide walks through every part of the app.
Features marked PRO belong to the ReefTracker Pro tier. If you installed the app before the Pro tier existed, you have the Founder's Edition: every feature that existed at that point stays free for you forever (see Editions). Features marked EXPERIMENTAL are hidden until you switch them on from the first-run welcome screen or later in Settings → Experimental.
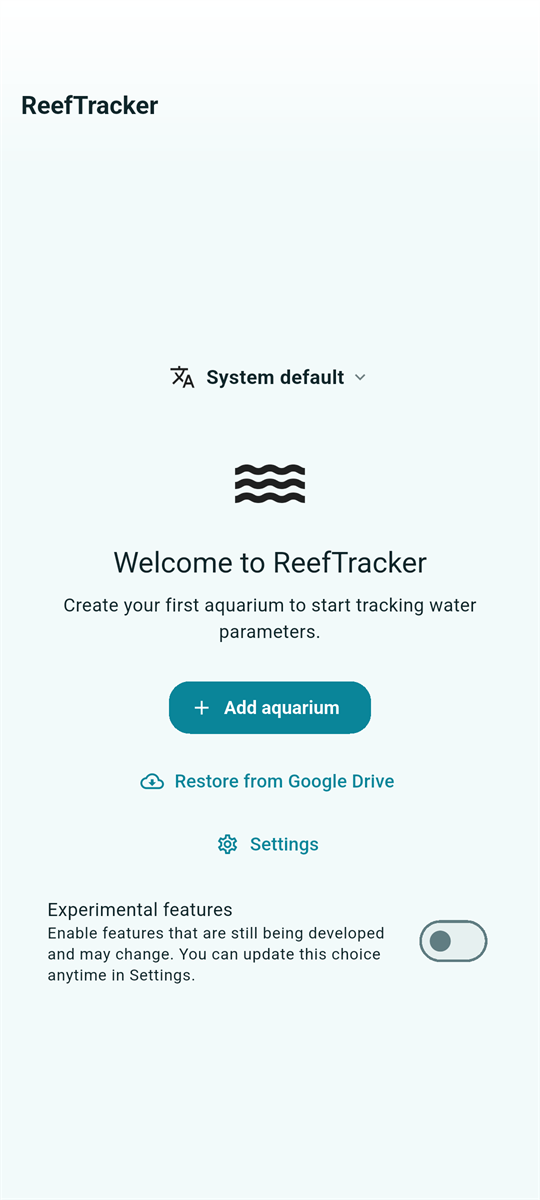
On first launch, pick your language and create your first aquarium. Experimental features are off by default; the subtle switch below Settings enables them if you want them, and the same choice remains available later in Settings → Experimental. Choose a setup type – fish-only, soft coral, LPS, SPS or mixed reef – and ReefTracker selects the recommended parameters and safe ranges for that kind of tank. Until you customize a range it keeps following the recommendation for your setup type – change the tank's type later and the colors follow – and you can set your own boundaries on any parameter at any time, so the preset is a starting point, not a commitment. Add the tank volume (used by the dose calculator), and optionally the vendor/model and a start date.
A short feature tour then highlights the less obvious controls in the top bar. You can replay it any time from Settings → Replay tour.
The app has four tabs that are always visible, plus a fifth Devices tab when experimental features are enabled. Everything except Settings applies to the currently active aquarium, shown in the top bar:
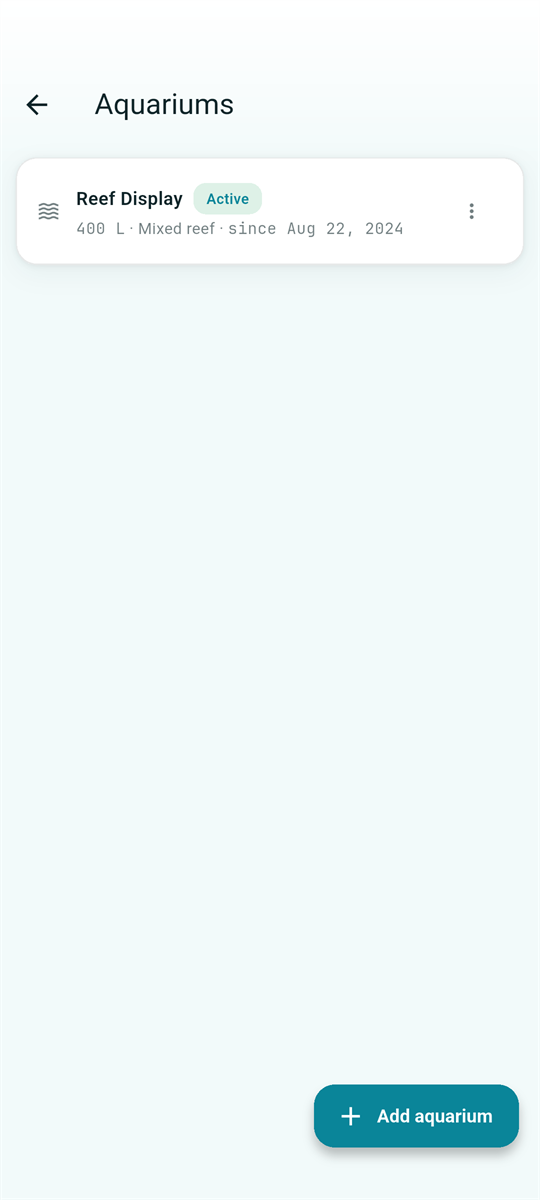
Tap the aquarium name in the top bar to switch tanks or open the aquarium list. Every row there carries that tank's health score in its own color and a line saying when it was last tested – turning amber once the readings go stale – so you can see how all your tanks are doing side by side; tapping a row switches to that aquarium and takes you back where you came from. Each aquarium keeps its own parameters, safe ranges, history, dosing plan and maintenance schedule. The Standard edition includes up to 2 aquariums (say, a display tank and a quarantine tank); unlimited aquariums are a PRO feature. Deleting an aquarium asks for confirmation and still offers a short Undo window afterwards.
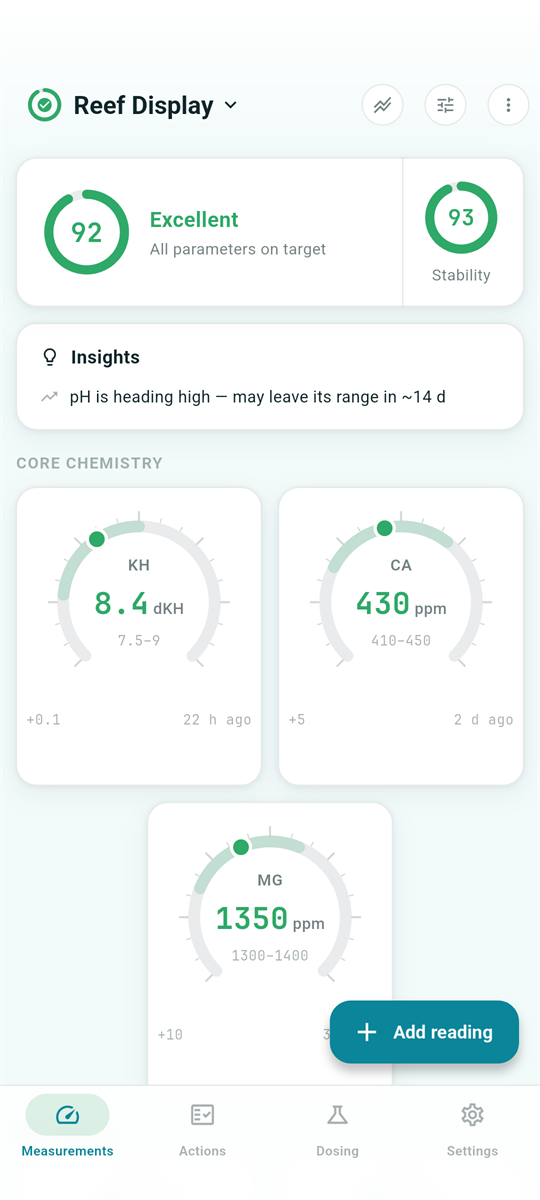
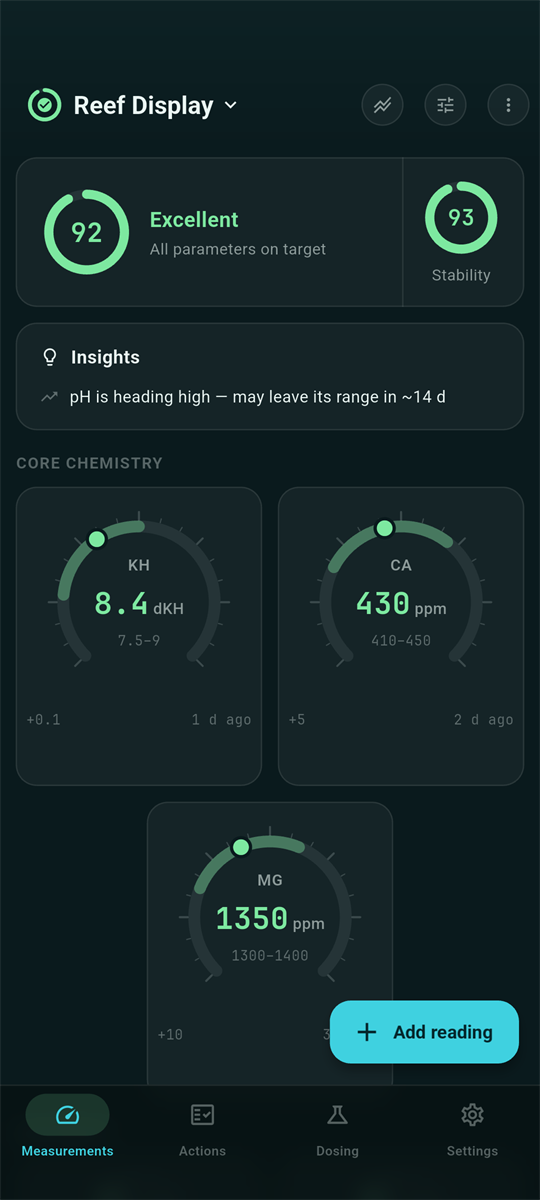
The Measurements tab shows everything at a glance, grouped into sections: Core chemistry (alkalinity, calcium, magnesium) as large gauge dials, Nutrients (nitrate, phosphate, ammonia, nitrite) as smaller gauges, Ratios as one combined card, Environment (temperature, pH, salinity, ORP) as compact pills, and a Microelements summary card. Every value is colored by its health zone – green (ideal), amber (attention) or red (act now) – against your own safe ranges.
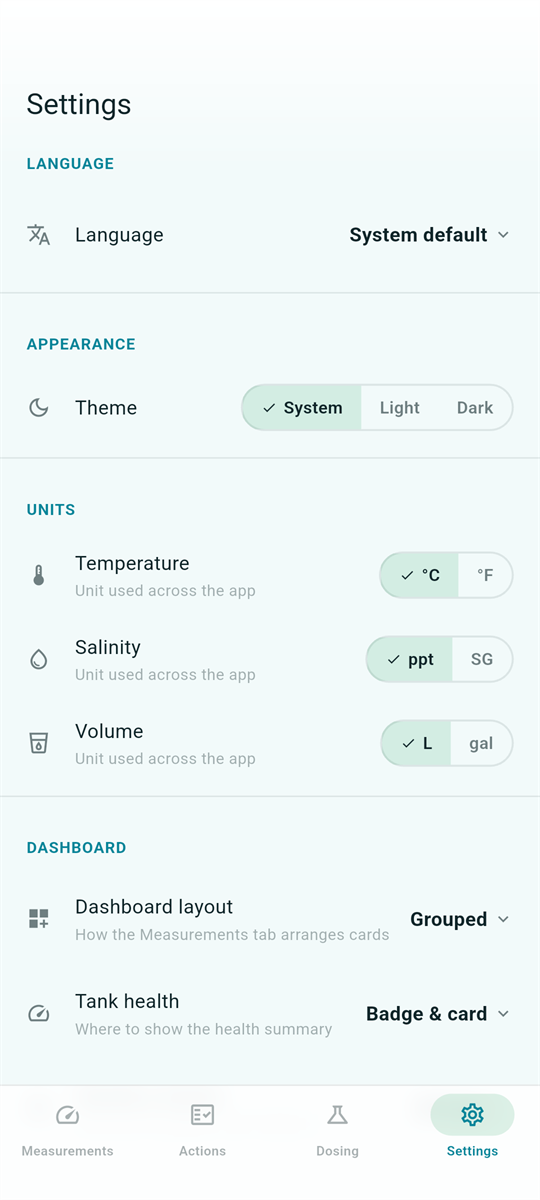
Tap any card to open that parameter's history graph. The layout in Settings → Dashboard offers three arrangements: the grouped sections above (Grouped), a single flat grid of cards in your own order (Flat), or that same grid with a small two-week graph above each value (Flat with graphs).
The card at the top condenses the whole dashboard into a 0–100 health score with a grade (Excellent / Good / Caution / Critical). The score is weighted by how much each parameter matters for a reef, and one red value can never hide behind a crowd of greens. Tap the health ring for a full breakdown – every parameter grouped by zone, each row linking to its history. Readings older than 30 days count as stale and are surfaced rather than silently coloring the dashboard.
The second ring is the stability score PRO – how much your values have been swinging over the last 30/60/90 days (window configurable in Settings → Dashboard), independent of where they sit right now. A tank can be in range yet unstable – corals feel that. Tap it to see which parameters vary the most.
Under the health card, the Insights PRO card lists the top observations about your tank in plain language: out-of-range values, values predicted to leave their range, recovering parameters and overdue tests. Everything is computed on your device by deterministic rules – no AI service, no network. When your tank is fresh, green and steady, the card simply disappears.
Want a deeper second opinion and do you trust generative AI? The Measurements tab's ⋮ menu → Ask your AI builds a ready-to-use prompt with your tank's full picture – current values against their ranges, trends, dosing plan and recent maintenance – that you can copy-paste into ChatGPT, Claude, Gemini or any AI chat you like for a comprehensive analysis and advice. The AI itself is not part of ReefTracker: the prompt is prepared entirely on your device, you bring your own AI tool, and the app sends nothing anywhere on its own.
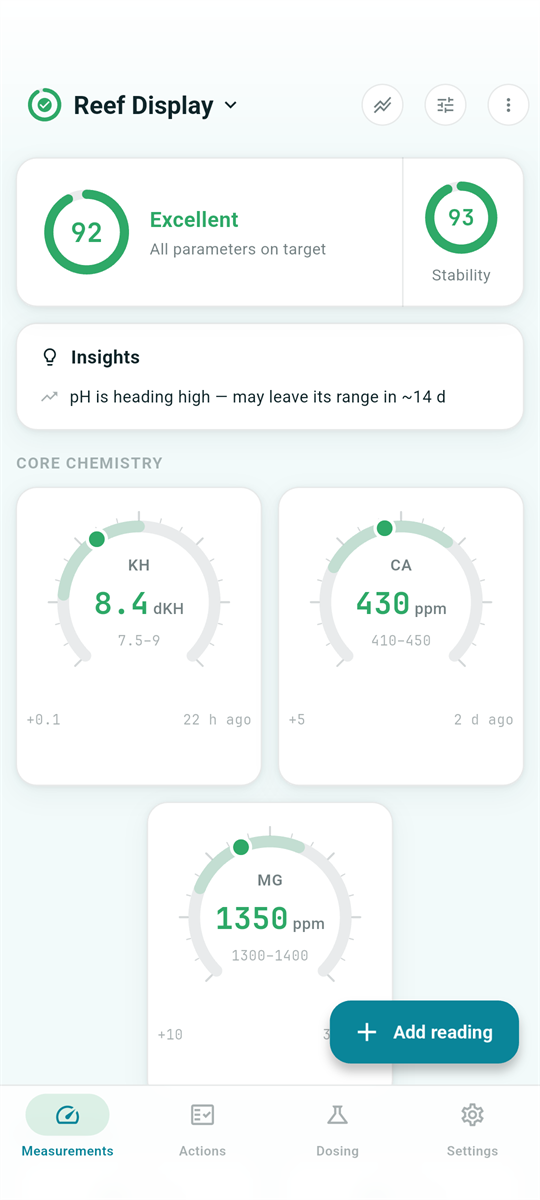
Tap the + Add reading button on the Measurements tab. Enter as many parameters as you tested – they are saved together as one session with a single timestamp, which you can backdate (but never future-date). Each value can carry a note, e.g. which test kit you used or what you observed.
The chip row at the top (All, your sets, +) filters the form to a named group of parameters – create a "Daily test" set with just alkalinity and nitrate, a "Weekly test" with the full panel, and so on. The app remembers your last choice per aquarium. Values you typed stay saved even if a chip currently hides them.
Physically impossible values (a pH of 80, a negative salinity) are rejected outright. Implausible-but-possible values ask for confirmation before saving, so a slipped decimal point doesn't wreck your graphs or trigger false warnings.
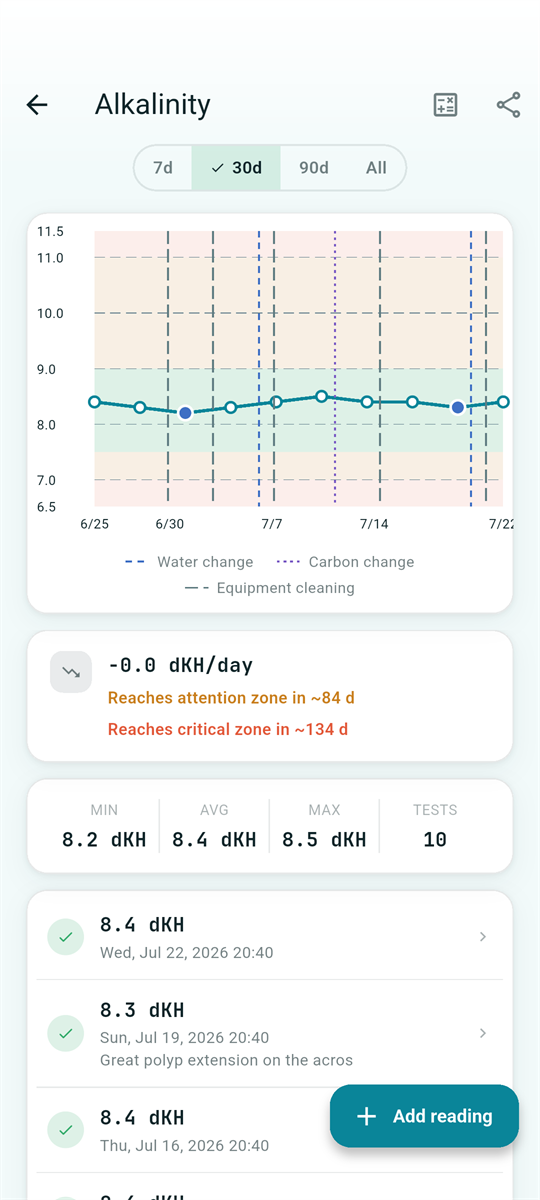
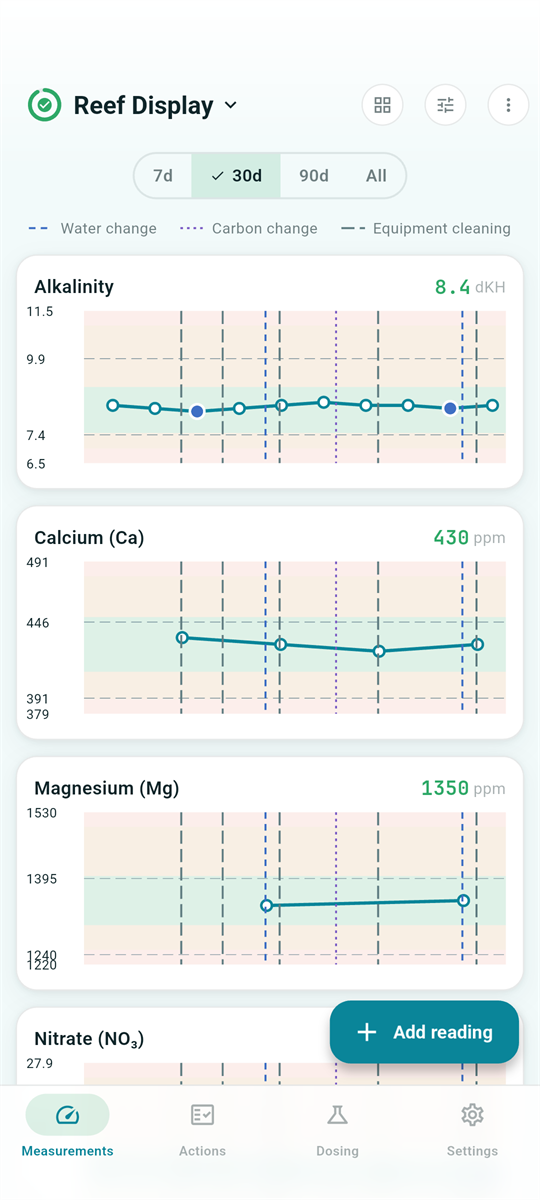
Tap any dashboard card to open its history. The graph draws your safe range as shaded bands behind the data, so you see at a glance when a value drifted out. Vertical dashed lines mark your water changes, carbon changes and equipment cleanings – each type with its own color and dash pattern – so maintenance lines up visually with parameter movements.
ReefTracker fits a trend through your recent readings and shows the per-day rate of change. If a value is drifting toward the edge of its range, the dashboard shows an early warning ("amber in ~5 d") before anything is wrong. A value that is out of range but heading back is recognized as recovering and shown positively instead of being flagged. A parameter whose readings merely swing – pH is the classic example – gets no forecast at all: when the readings scatter too much for their direction to be trusted, the parameter is reported as swinging, with the size of the typical swing (say "±0.11 pH") on the trend card and an Unsettled marker on its dashboard tile, rather than a confident warning drawn through the scatter. The trend window and alert horizon are configurable in Settings → Trends.
The compare view (chart icon in the top bar of the Measurements tab) stacks all parameter graphs on one screen with a shared time range – ideal for spotting relationships, like alkalinity falling while calcium holds.
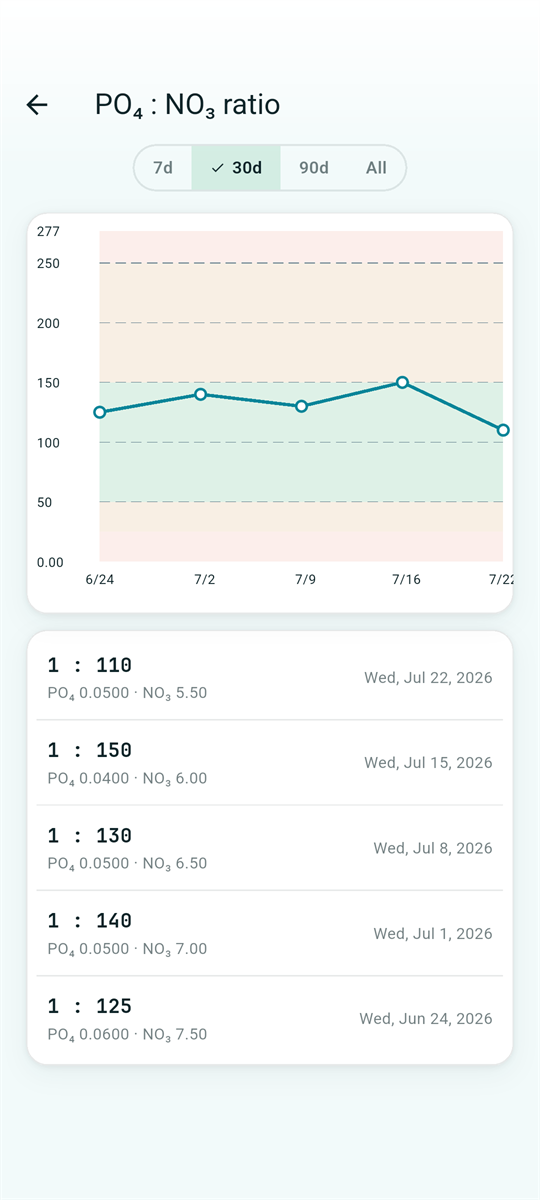
Some things matter as a relationship, not a number. The dashboard's Ratios card tracks PO₄ : NO₃ (the Redfield-style nutrient balance), Mg : Ca, Ca : Alk and Mg : Alk, each with a recommended zone you can edit per tank. Tap a row for the full ratio graph with the same zoom, pan and value popups as parameter graphs. Ratios only combine readings taken reasonably close together – today's phosphate is never divided by a months-old nitrate.
The free (toxic) ammonia row estimates the un-ionized NH₃ fraction of your total ammonia reading from your pH, temperature and salinity, using published scientific models, and compares it against EPA-anchored toxicity limits. Tap it to see the math and the exact inputs used. This matters because the same total ammonia is far more toxic at reef pH than in a low-pH tank.
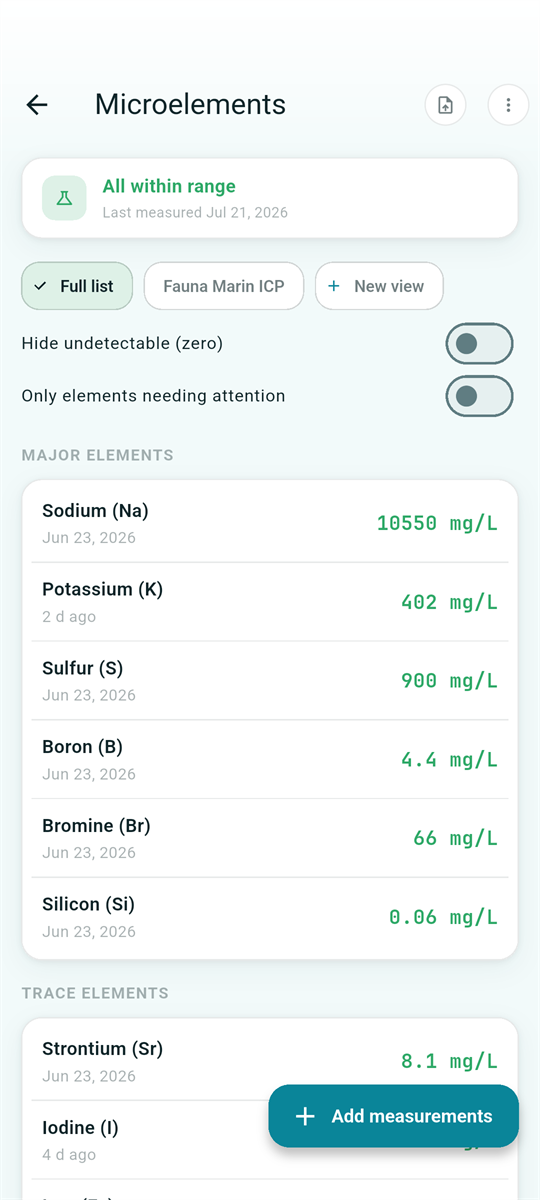
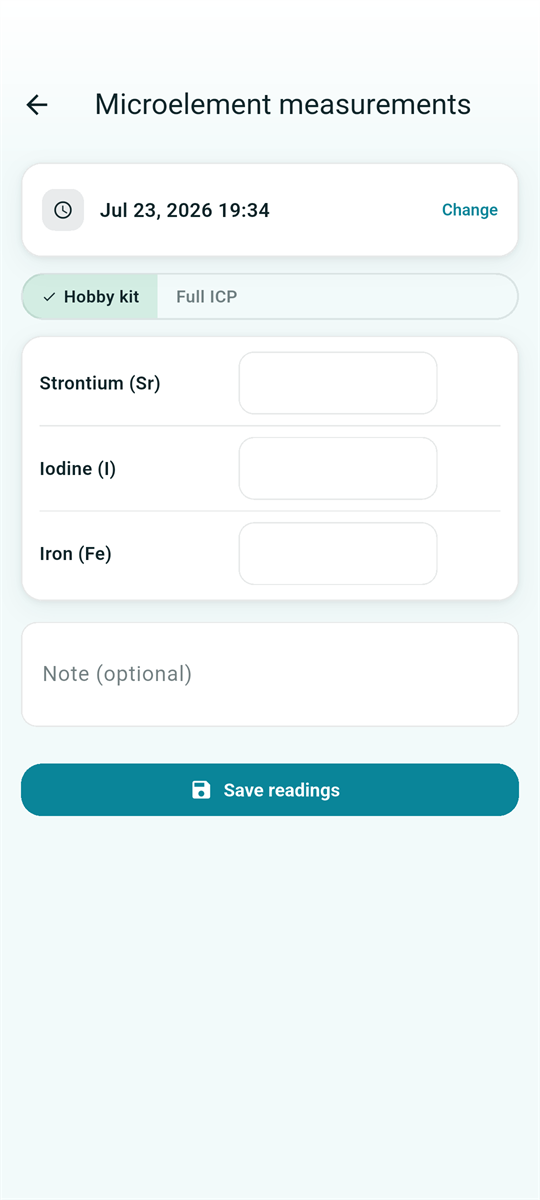
The Microelements screen (tap the dashboard's Microelements card) tracks 39 elements across ATI, Fauna Marin and Oceamo analyses: major ions, desirable trace elements and contaminants. Defaults are anchored on natural seawater and ICP-lab targets; contaminants use one-sided "up to a ceiling" ranges. Units follow ICP convention – mg/L for majors, µg/L for traces and contaminants.
If you don't track trace elements, switch the whole feature off in Settings – the dashboard card disappears, your stored values remain.
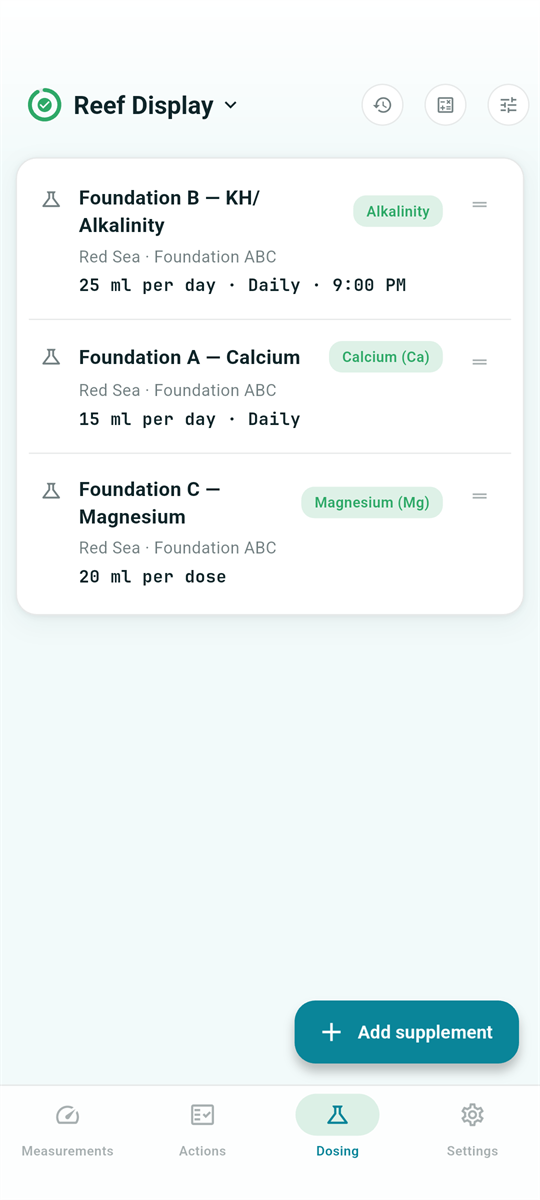
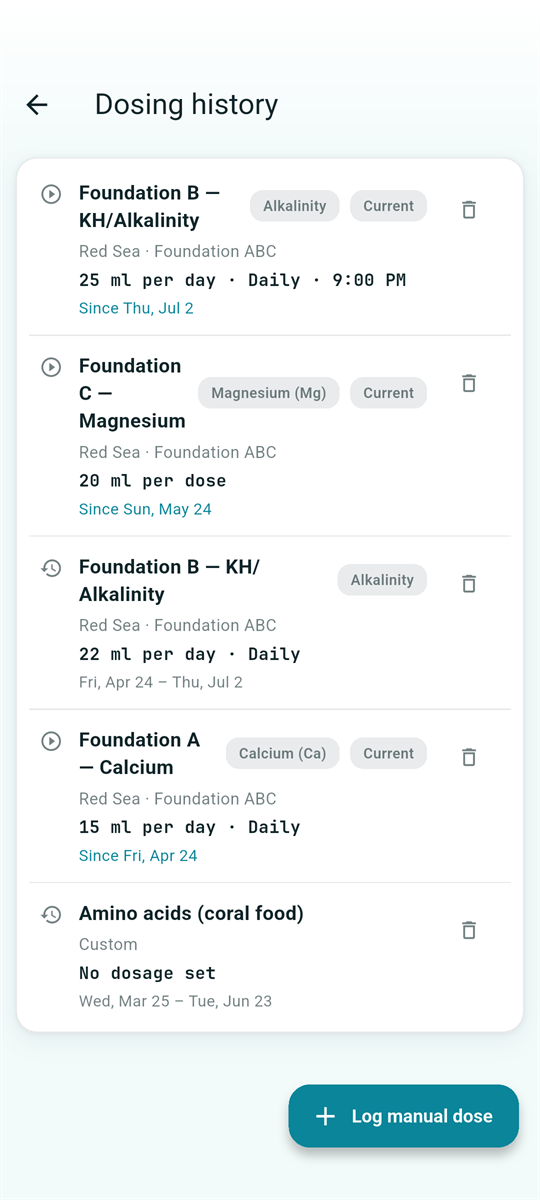
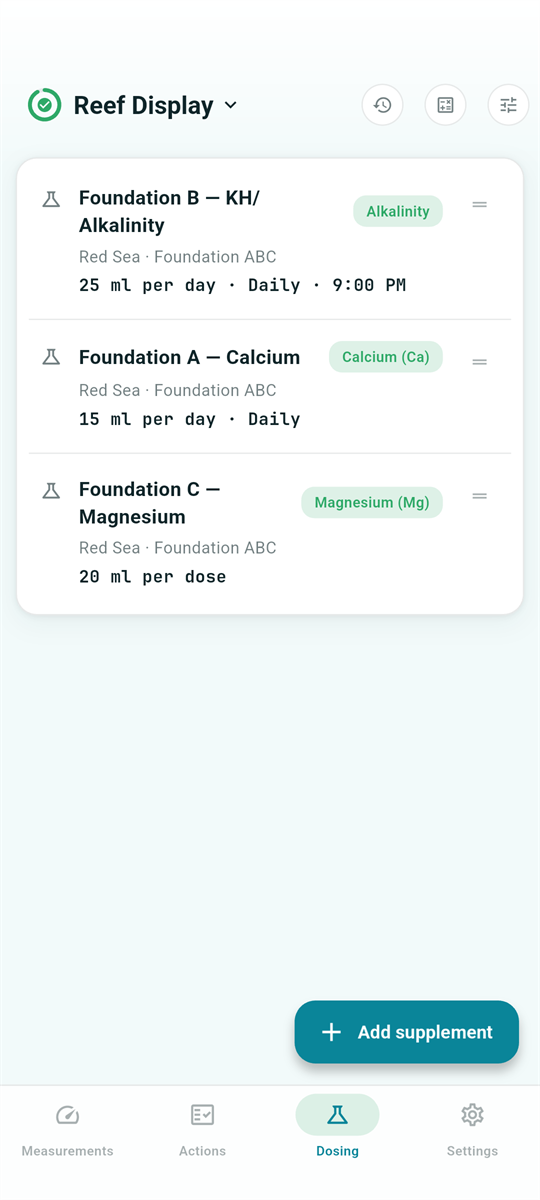
The Dosing tab records your standing supplement regimen: what you dose, how much, and on which schedule (daily, every N days, or fixed weekdays at a set time). Pick products from the built-in catalog of reef brands and dosing programs – with verified potencies – or add custom products for anything else. Each entry is tagged with the current dashboard status of the element it targets, so you can see at a glance whether the thing you're dosing for is actually in range.
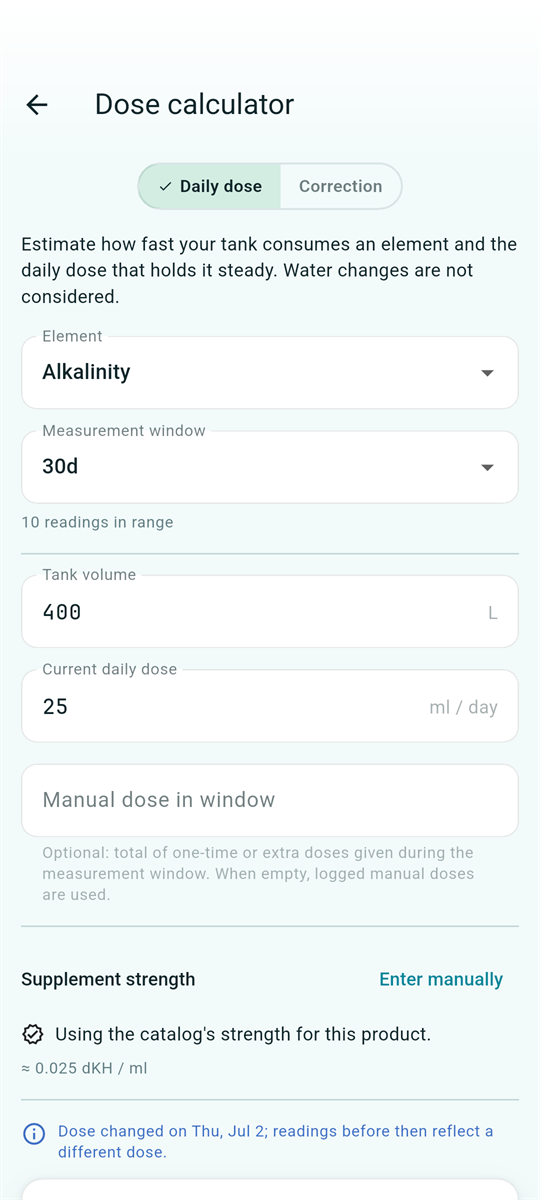
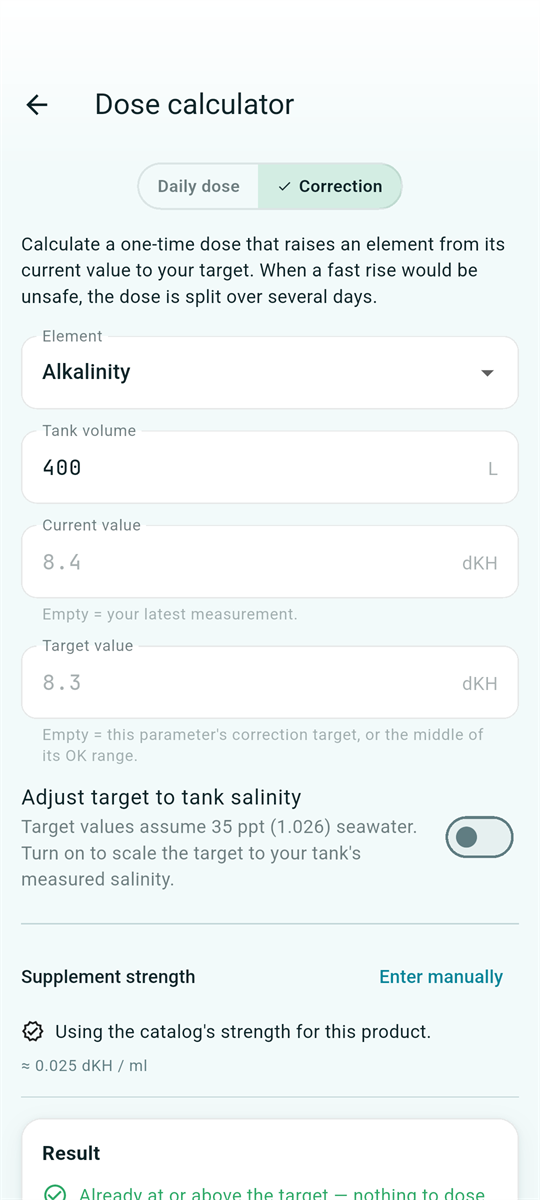
Open the calculator from the Dosing tab's top bar, or from a dosable parameter's history screen. It has two modes:
Computes your tank's actual daily consumption of an element from your recent readings, your current dosing and any logged manual doses – then recommends whether to raise, lower or keep the current dose. Inputs (element, time window, tank volume, current dose, supplement strength) are pre-filled from your data and all editable. The result card explains itself: measured change per day, consumption per day, dosing input per day, and a clear guidance line – including an over-dosing warning when you're dosing more than the tank consumes.
Computes the one-off dose to lift an element from its current value to a target. Current value and target are pre-filled (latest reading and your tank's target). When the needed rise exceeds the element's safe daily limit, the plan is automatically split over several days, with the per-day dose highlighted. The optional "Adjust target to tank salinity" switch scales book targets (stated for 35 ppt) to your tank's actual measured salinity. A Log this dose button records what you just added as a manual dose – which then feeds back into the daily-dose math.
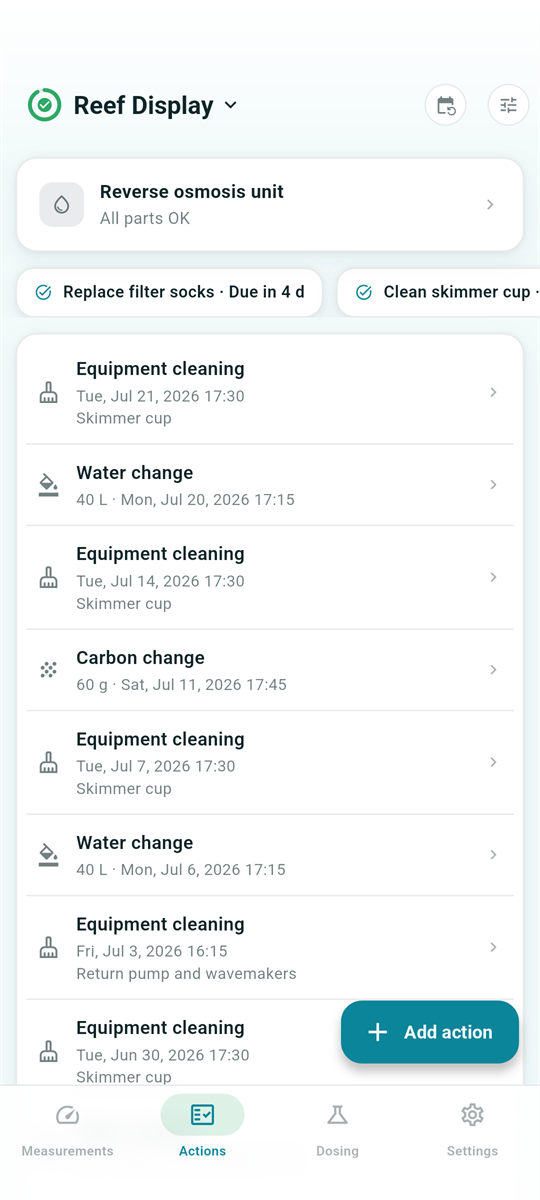
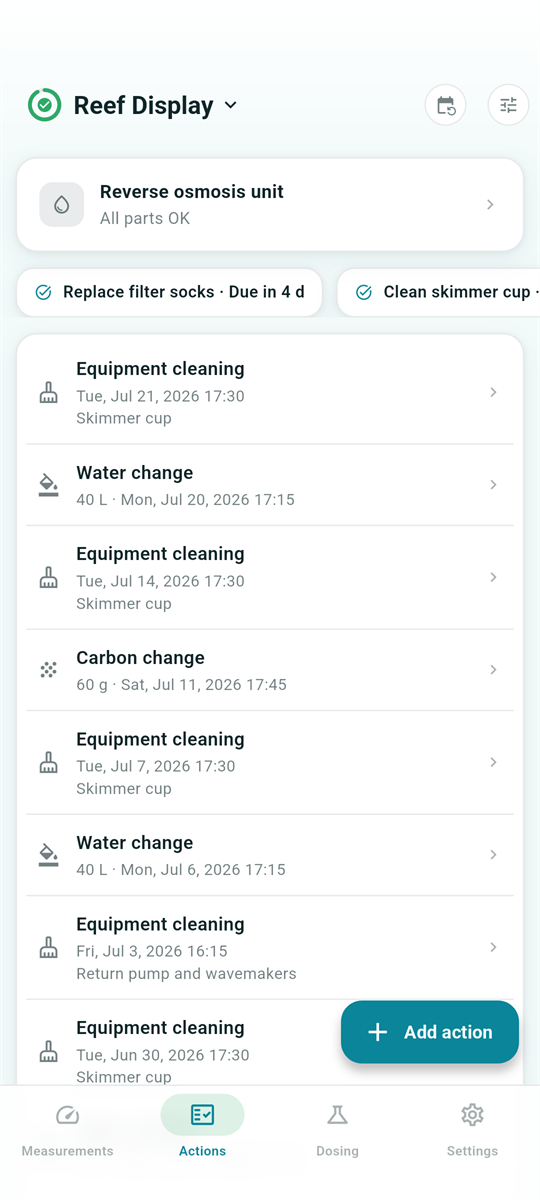
The Actions tab is your maintenance logbook. The + button logs a water change (with volume), a carbon/media change (with weight) or an equipment cleaning – each with an optional note and a backdatable timestamp. Every entry can be edited or swiped away (with Undo), and all three types appear as dashed markers on your parameter graphs.
The calendar icon opens your maintenance schedule: recurring or one-off tasks, either typed (water change, carbon change, cleaning) or custom-titled ("clean skimmer cup"). Repeats can be every N days/weeks/months, fixed weekdays ("every Monday"), or a fixed day of the month ("every 1st").
Scheduling is elastic: completing a task resets its timer from the day you actually did it, so doing a water change three days late doesn't stack phantom overdue warnings. Typed tasks advance automatically whenever you log the matching action anywhere in the app. Due and overdue tasks appear as chips above the action log – tap a chip to log the action or mark the task done.
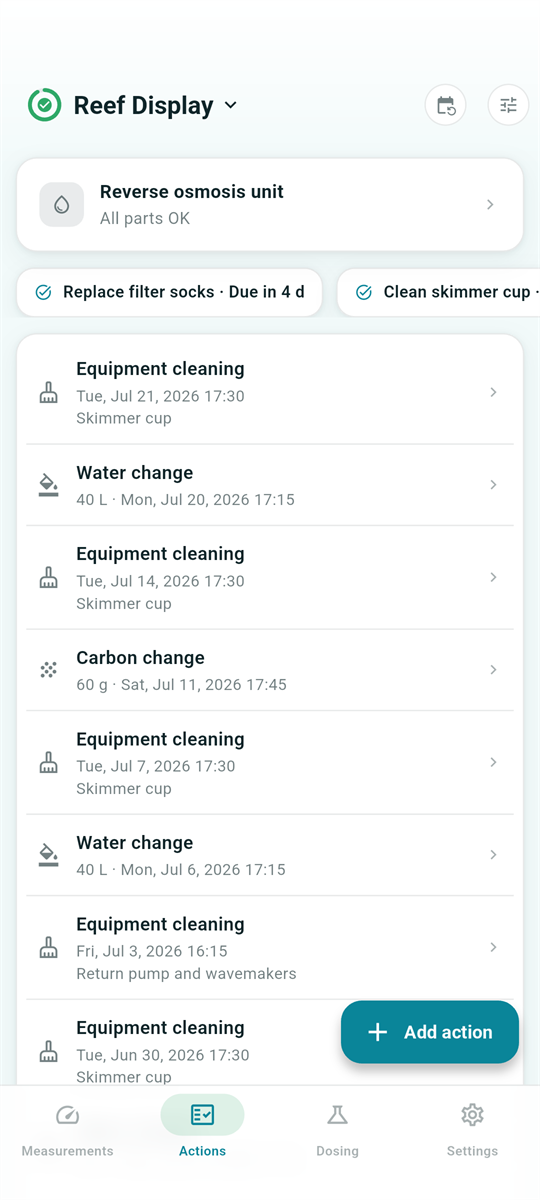
ReefTracker tracks your RO/DI unit as a household appliance shared by all your aquariums – one unit, one place, reachable from the card at the top of every tank's Actions tab. The typical four stages are pre-configured with sensible lifespans (sediment 3 months, carbon block 6 months, membrane 24 months, DI resin 4 months); add custom stages or disable ones your unit doesn't have.
Tell the app how heavily the unit is used – Light (under ~300 L a month, top-offs and small water changes), Moderate (~300–1000 L, the level the lifespans above assume) or Heavy (over ~1000 L, large or multiple tanks) – and the standard stages take the replacement intervals typical for that usage: a sediment filter lasts 6 months on Light and 45 days on Heavy. Picking a level resets the interval of every standard stage, including any you had tuned yourself, so pick one before fine-tuning rather than after; custom stages you added are never touched, and every stage stays individually editable afterwards.
Each stage shows a remaining-life bar with green/amber/red due status. Tap Mark replaced when you change a filter – the date can be backdated and every replacement is kept as history (with Undo). Optional reminders notify you when a stage is due. No RO unit? Switch the feature off in Settings.
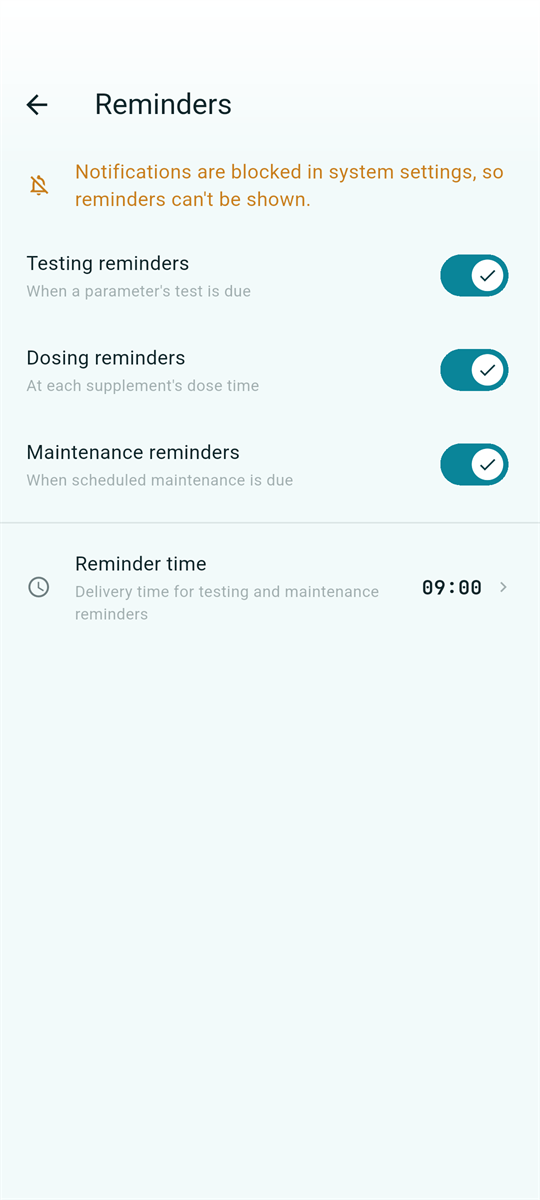
All notifications are opt-in – the app stays silent until you enable them in Settings → Reminders. Three kinds:
Testing and maintenance reminders arrive at a configurable time of day (default 09:00). Overdue items don't re-notify – the due chips on the Actions tab carry the overdue state instead.
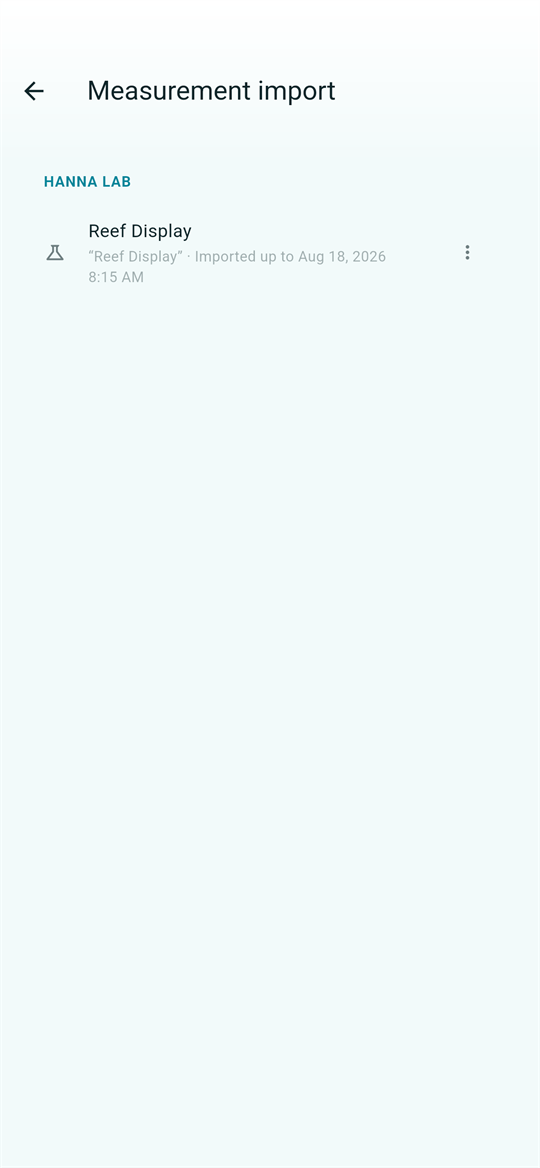
If you test with a Hanna HI97115 Marine Master photometer, export the test history CSV from Hanna's Hanna Lab app and import it via the Measurements tab's ⋮ menu → Import measurements. Readings keep their original timestamps, tests taken together stay grouped as sessions, and re-importing the same file only adds what's new – no duplicates, ever. Every import can be undone with one tap.
With experimental features enabled (Settings → Experimental), the ⋮ menu gains Hanna checker: connect to a HI97115C over Bluetooth and run measurements live – method by method or via your saved test sets – then save the confirmed results with the meter's own timestamps. Before saving, untick a value you do not trust or send it back to the checker for a re-test. The app can also offer the current salinity, temperature, pH and ORP from ReefFactory and ReefControl devices assigned to the same aquarium, so the environment joins the same test session without duplicate parameters. Built-in reagent reaction timers (15 s / 30 s / 2 min) beep when the wait is over, and the screen stays awake while a test runs. Once connected, the checker also has a card on the Devices tab. Measurements only: meter settings and firmware updates stay in Hanna's own app.
For Hanna pocket checkers (the small single-parameter colorimeters with an LCD), point your camera at the display and ReefTracker reads the value for you – no typing. 14 checker models are supported; the model is recognized automatically from the case color and the reading's format, and the app only asks when models would interpret the value differently. Recognition runs fully on your device – no photos are stored or uploaded. The viewfinder starts at 2× zoom so you can scan from a comfortable distance. An optional quick-scan camera button next to Add reading can be enabled in Settings → Experimental.
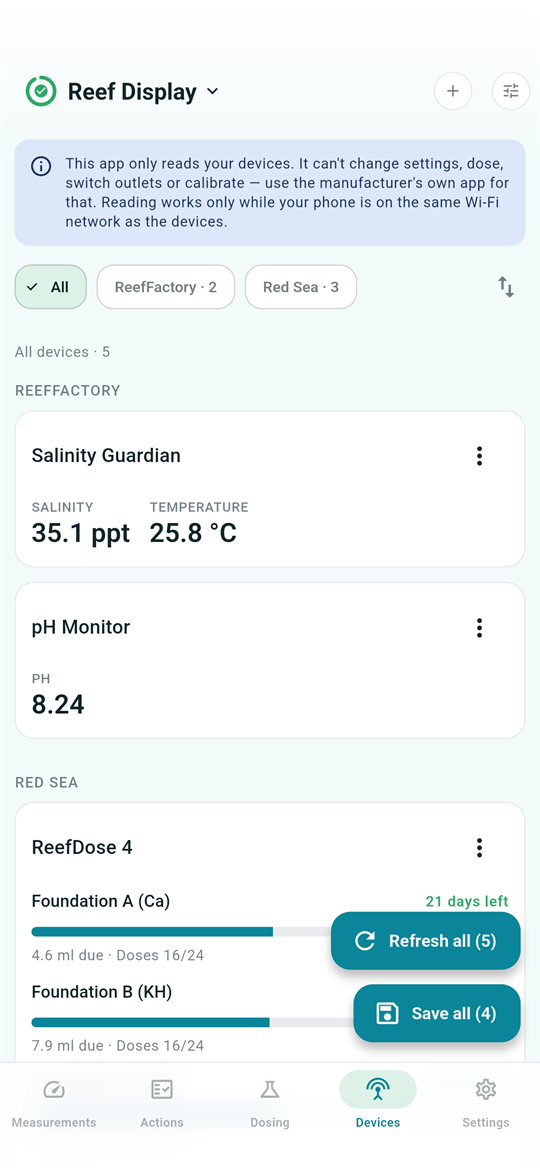
If ReefFactory smart meters, Red Sea ReefBeat equipment or a Neptune Apex controller run on your aquarium, ReefTracker can talk to them directly over your home Wi-Fi – no cloud account in between. Everything lives on one Devices tab in the bottom navigation bar. The tab appears once experimental features are enabled (Settings → Experimental). A row of brand buttons across the top switches between All – every device, grouped by brand – and one brand at a time; brands you don't own never appear, and with a single brand the buttons disappear entirely. You can also swipe sideways anywhere on the page to step to the next or previous brand without scrolling back up to the buttons. Everything is strictly read-only: ReefTracker never doses, never switches an outlet, never changes a schedule and never calibrates – settings and firmware stay in the vendor's own app.
Tap + in the top bar and ReefTracker searches your Wi-Fi for ReefFactory meters and Red Sea ReefBeat devices, then lists what it found so you can add each one with a single tap – no hunting for IP addresses in your router's settings. Typing an IP address or hostname by hand remains available for unusual network setups, and an Apex controller is always added that way, together with the login you use on its own web page.
Devices are recognized by their hardware identity, not their address. When your router hands a device a new IP and its card stops responding, run Scan network again: the scan spots the moved device and one tap points its card back at it, keeping the card's name, aquarium and position – re-adding it as a new device isn't needed (and the app will tell you so if you try). Reserving a fixed IP for each device in your router's settings avoids the shuffle entirely. The Edit item in a card's menu renames a device to whatever you call it, and Details shows its brand, model, address and when the app last reached it.
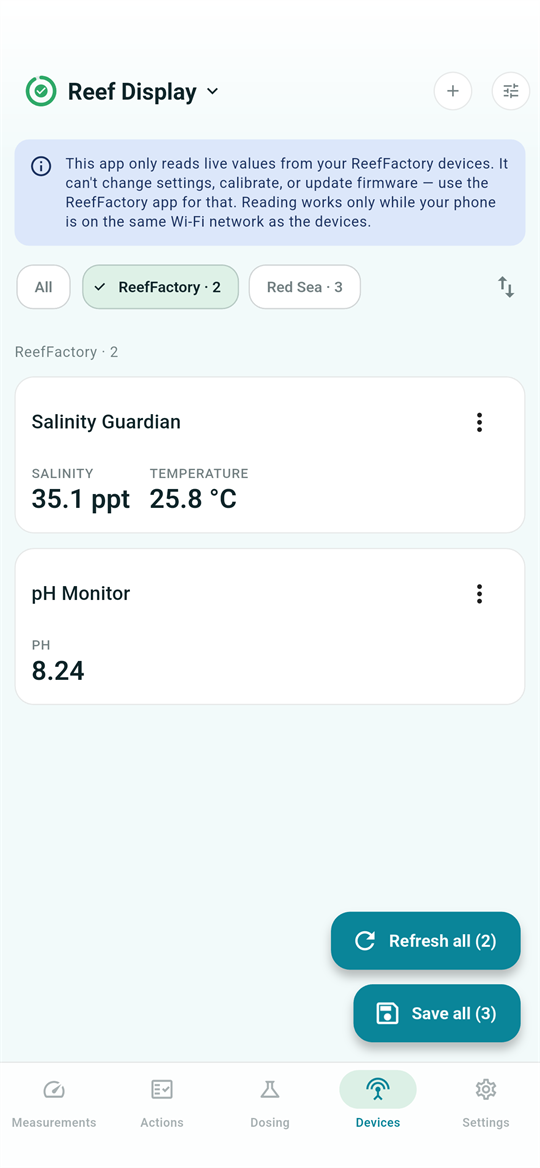
Supported meters: the Salinity Guardian, the pH Monitor and the Temperature Controller. The app identifies the model and names the card after the ReefFactory product. Each card shows the meter's current values with a Save action in its ⋮ menu. Saved values become ordinary readings for the tank the meter is assigned to, feeding your graphs, trends and health score like any hand-entered test. The Temperature Controller's temperature carries a Heating or Cooling badge whenever the controller is actually running that output.
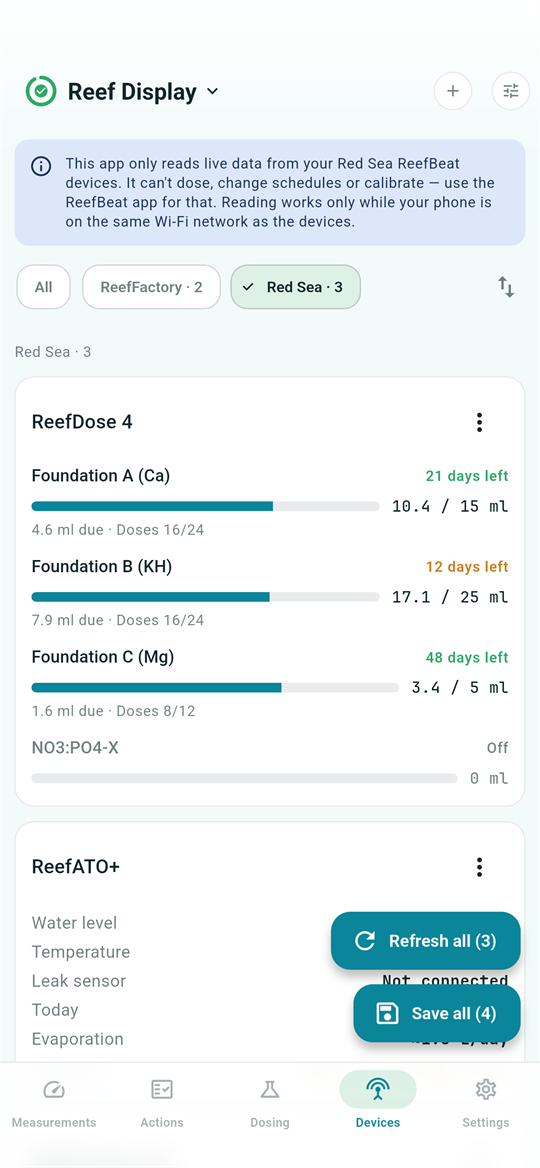
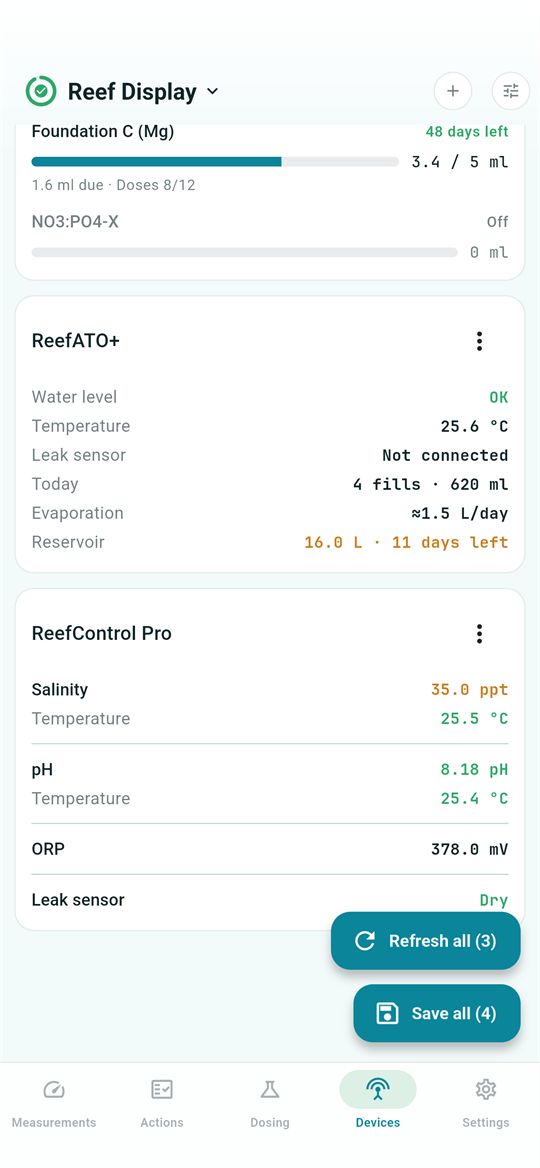
The ReefBeat cards show operational status rather than values to save, except ReefControl's probe card. Seven device families are supported:
Add your Apex by its IP address and the login you use on its own web page – both current (AOS 5) and older Apex, Apex Jr and Apex Classic controllers are supported, and the app works out which it is talking to. The card shows the controller's probe values – temperature, pH, ORP and salinity, plus a Trident's alkalinity, calcium and magnesium – ready to save as measurements, and the app reads whether your Apex is set to °C or °F so the temperature is stored correctly either way. The card also shows what every outlet is doing, flags an outlet that has been switched by hand and no longer follows its program – the forgotten override that leaves a return pump off after a water change – and tells you when a feed cycle is pausing the pumps. Switching outlets, feed cycles and programs stay in Fusion. Your Apex password never leaves the phone: it is kept out of your backups, out of the copy Android keeps in your Google account and out of a transfer to a new device – a restored install keeps the controller but asks you to sign in again.
The tab reads every device in view when it opens, when you return to it or reopen the app on it, and when you revisit a brand after two minutes. Pull down past the top or tap Refresh to re-read exactly the devices currently on screen – and says how many that is – so filtering to one brand leaves the rest of your equipment alone. Save all stores the readings of every meter in view in one go, counts the distinct parameters that will be stored, and merges values taken moments apart into a single test session. Values older than a couple of minutes are re-read before saving, so opening the page, getting distracted and saving an hour later never stamps hour-old probe values as a fresh measurement.
When two devices report the same reading for the same aquarium, the one higher up the page wins, and the confirmation names the device the value came from. You set that preference simply by ordering: press and hold a card to move it above its neighbours, or reorder whole brands with Reorder brands in the page's menu. The order is remembered and travels with your backups.
Before a device reading joins your history, the app checks it the same way it checks what you type by hand: a value far outside the typical range for its parameter, or one that reads as nothing at all – 0 dKH, no salt in the water, the classic sign a probe has come loose – is shown to you with its typical range beside it. Keep it if you know it's real, or skip just that value and still save everything else the other devices reported.
Live reading is a PRO feature – one entitlement covers all supported Wi-Fi equipment. Whatever your edition, the Devices tab still lists every device you've added – ReefFactory meters, Red Sea ReefBeat devices, your Apex and your Hanna checker – and each card's Details shows its model, address and when the app last reached it.
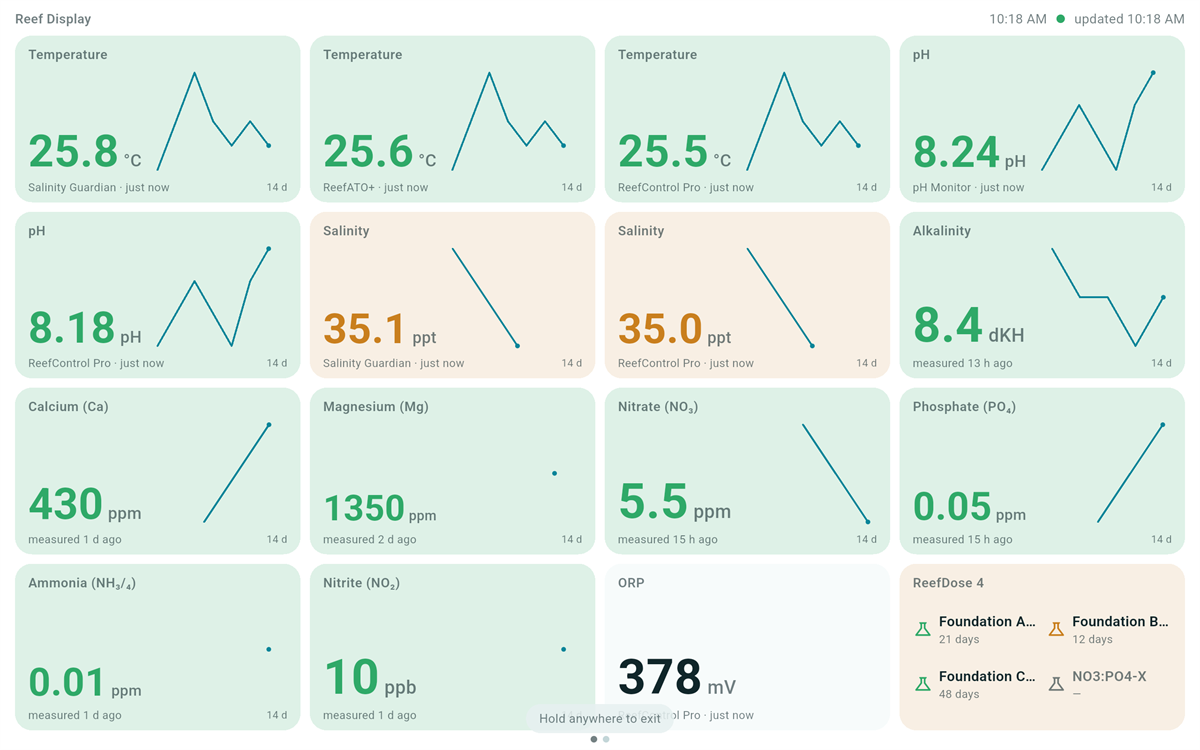
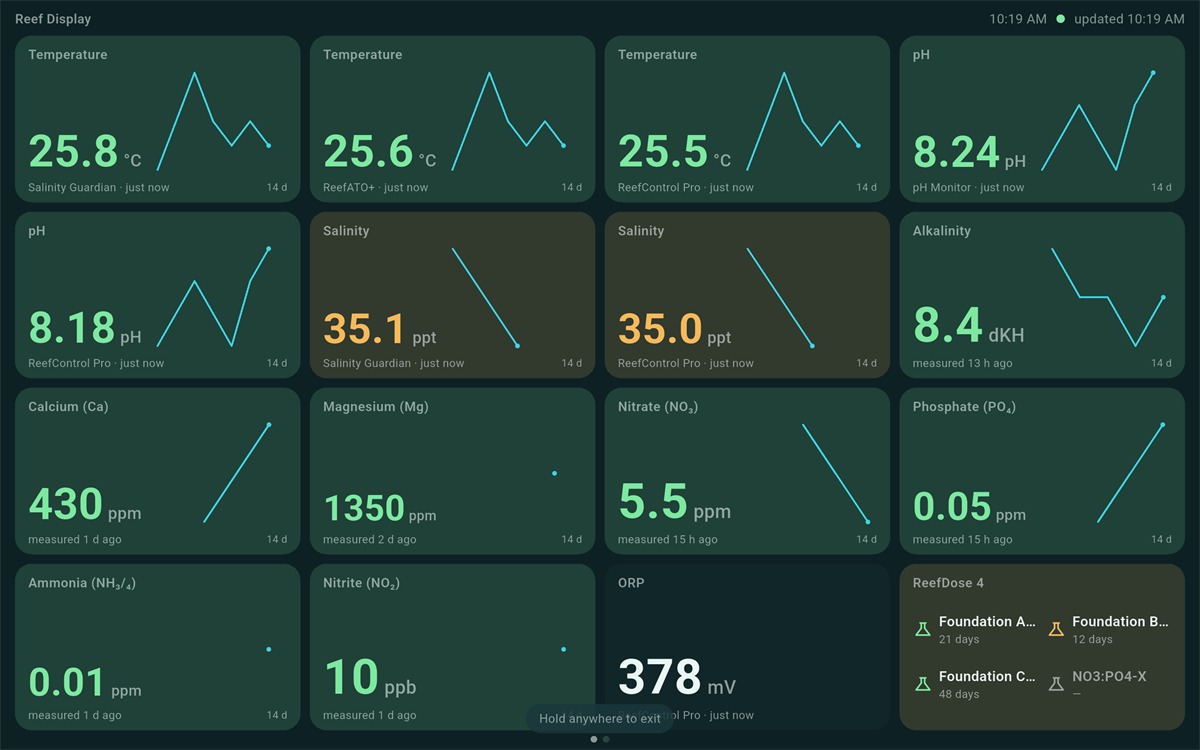
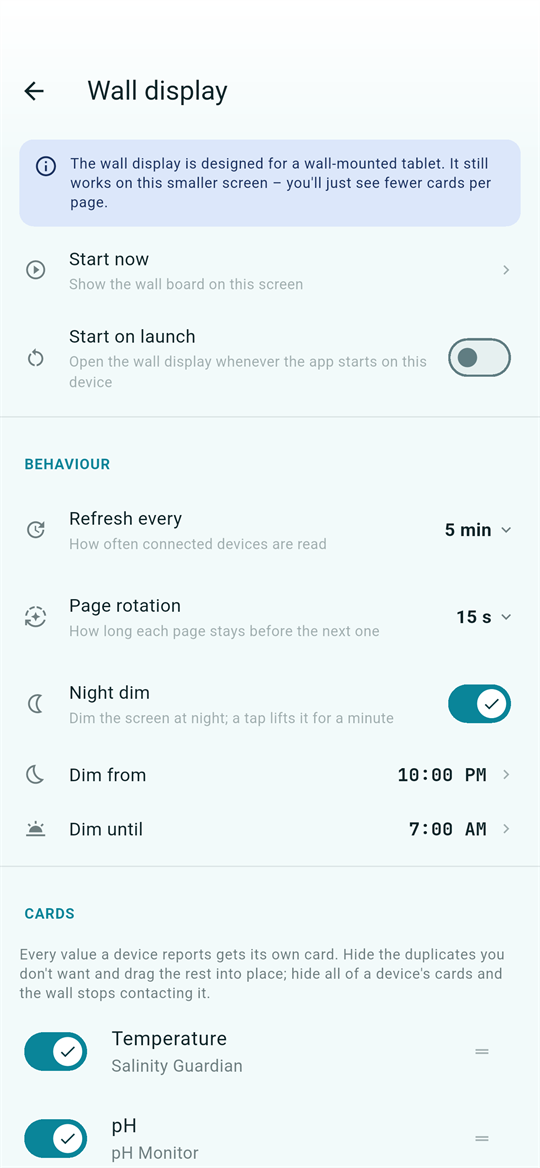
Open Settings → Wall display to turn a wall-mounted tablet into an always-on aquarium board. Tap Start now, or enable auto-start so the app returns to the board after that tablet reboots. The board never scrolls: it sizes its cards to the screen, moves overflow onto rotating pages, keeps the screen awake, hides the system bars and gently shifts the grid to reduce OLED burn-in. Leaving takes a deliberate press-and-hold.
Each water parameter gets a large, color-coded card. Every connected device gets its own value card and independently scaled 24-hour min/max graph built only from that device's live readings. Manual readings stay on their own cards with a 14-day graph, so a hand test never changes a device graph. Those live graph samples are display-only, never added to your measurement history, and can be cleared or trimmed to the latest 1, 4 or 12 hours from Wall display settings. Status cards cover the ATO level and reservoir, leaks, dosing-head supply, fleece roll and skimmer cup, and an optional strip lists today's due tasks.
Under Cards, hide duplicates and drag the rest into your preferred order. Hiding every card from a device also stops Wall display from polling that device. You can choose the refresh interval, page-change timing and night-dimming window. The board also works with no connected hardware at all, using only your stored readings.
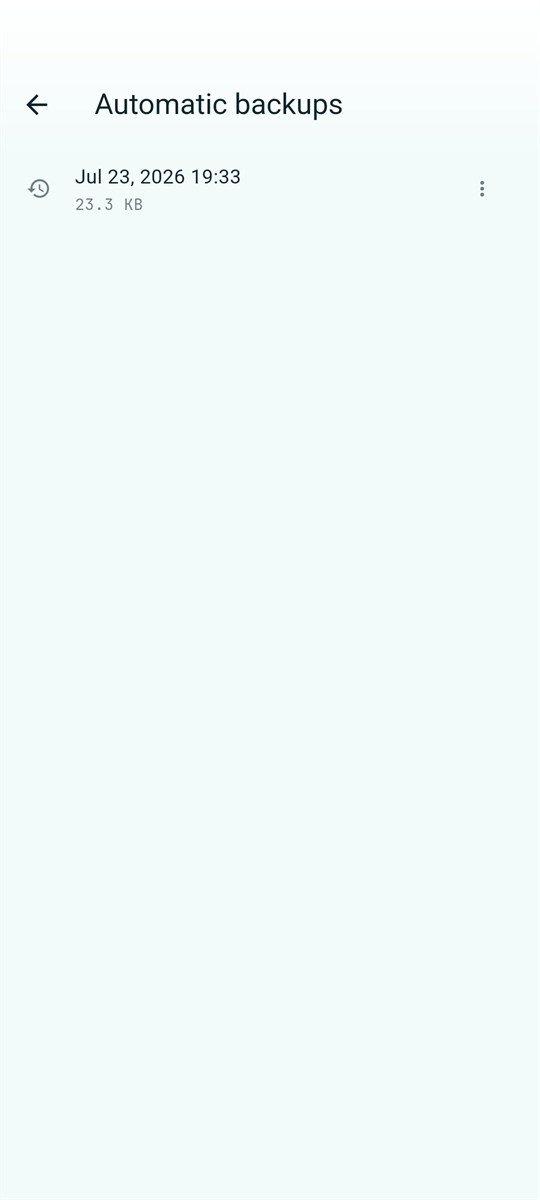
Everything lives on your device, so backups matter. In Settings → Backup & Restore:
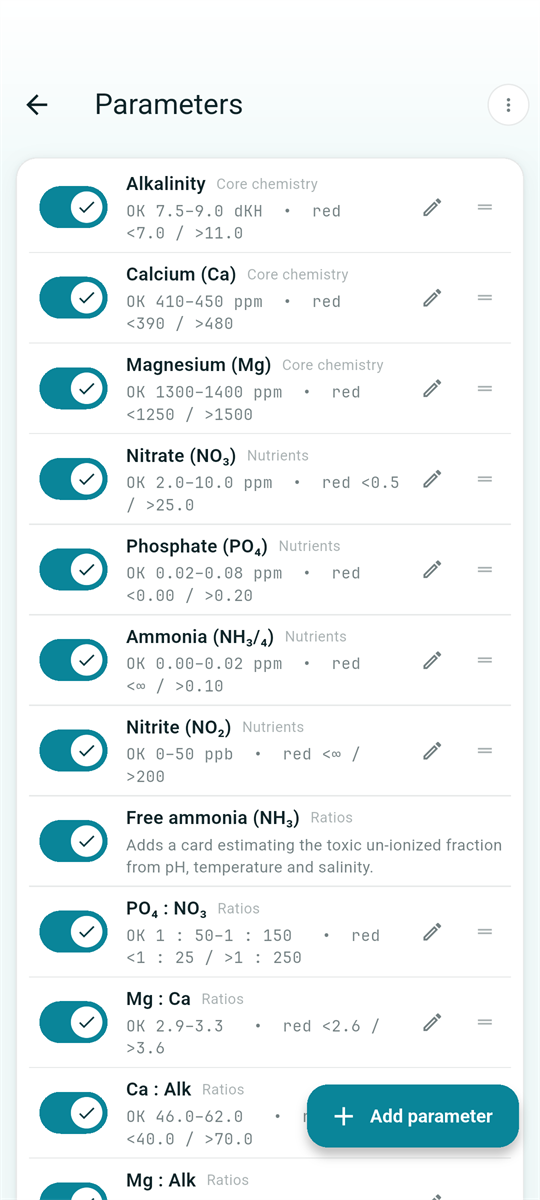
The sliders icon in the top bar opens Manage parameters: choose which parameters you track, drag to reorder them, and tap one to edit its safe ranges – the green/amber/red bounds every color in the app derives from – plus its target value and testing reminder. Ranges are per aquarium, so your SPS display and your quarantine tank can have different targets. Swipe a parameter away – or use Untrack while editing it – to drop one you never test: its readings and any ranges you set are kept, an Undo is offered, and adding the parameter back later restores its full history. Ratio cards and the free-ammonia row are managed here too.
A parameter you haven't customized shows Following the defaults: it reads the recommended range for your aquarium type (or the built-in default, for microelements) as it stands today, so changing the tank's type re-colors it immediately and improvements to the recommended ranges arrive with app updates on their own. Boundaries you set yourself stick until you clear them – a Reset to defaults action on the parameter (and, for the whole tank, in the Manage parameters menu) returns things to the recommendations.
The salinity calculator (Settings → Tools) converts among ppt, specific gravity and density readings from European glass hydrometers (areometers), including models from ARKA and Tropic Marin. These instruments are typically calibrated at 25 °C. When prepared saltwater in a measuring cylinder is closer to ambient temperature, enter that water temperature and ReefTracker corrects both seawater and glass expansion back to the 25 °C reference. Measuring at 25 °C remains the most accurate method.
Its Mix new water mode estimates the dry salt for a chosen volume and target salinity. Pick one of the supported salt mixes for a starting point, or calibrate it from a batch you measured so that aquarium remembers your real mix. Correct this tank estimates an equal-volume RO/DI or prepared-saltwater exchange to move the active aquarium toward its target; mix outside the aquarium, measure, then adjust.
The water-change planner projects how one or repeated batch changes – or continuous automatic exchange – may move a measured dissolved parameter. It starts with the active aquarium's volume, last value, target and most recent water-change size, and clearly labels its complete-mixing and no-new-production assumptions. Reef unit converter is a quick scratchpad for alkalinity (dKH, meq/L and ppm CaCO₃), temperature (°C and °F), and volume (litres, US gallons and Imperial gallons): edit any field and the equivalents update immediately.
ReefTracker's core is free for everyone: unlimited readings, graphs, trends, dosing plans, maintenance, reminders, backups and 2 aquariums. The Pro tier adds the power features marked throughout this guide:
| Pro feature | What it adds |
|---|---|
| Unlimited aquariums | Beyond the 2 included tanks |
| Tank stability score | The second axis of tank health |
| Smart insights | Prioritized plain-language observations |
| Dose calculator | Consumption analysis & correction doses |
| ICP report import | One-step Fauna Marin or ZIMS CSV, and ATI, Fauna Marin or Oceamo PDF import |
| Hanna Lab import | CSV import from the Hanna Lab app |
| Hanna checker connection & scan | Live Bluetooth measurements and camera reading (experimental) |
| Connected devices | ReefFactory, Red Sea ReefBeat & Neptune Apex live over your Wi-Fi – one entitlement covers all brands (experimental) |
| Wall display | Always-on value graphs, equipment status and due tasks for a wall-mounted tablet |
| Cloud backup sync | Automatic backups to your Google Drive (Android) or iCloud Drive (iOS) |
Founder's Edition: if you installed ReefTracker before the Pro tier launched, the features that existed then remain free for you forever – including when you move to a new device. You can check your edition in Settings → About.
Whatever your edition, your data is never locked away – anything you created stays viewable, editable and exportable.
Questions, bug reports and feature requests are welcome at bobrovsky@seznam.cz – please include your device model, OS version and app version (Settings → About). If something goes wrong inside the app, Settings → About → Share diagnostics hands you a small text file of the errors the app recorded on your device – attach it and the problem is far easier to track down. Nothing is ever sent anywhere unless you share it yourself. See also the support page for frequently asked questions and the privacy policy.